
Rail & Road Noise Pollution
What is it?
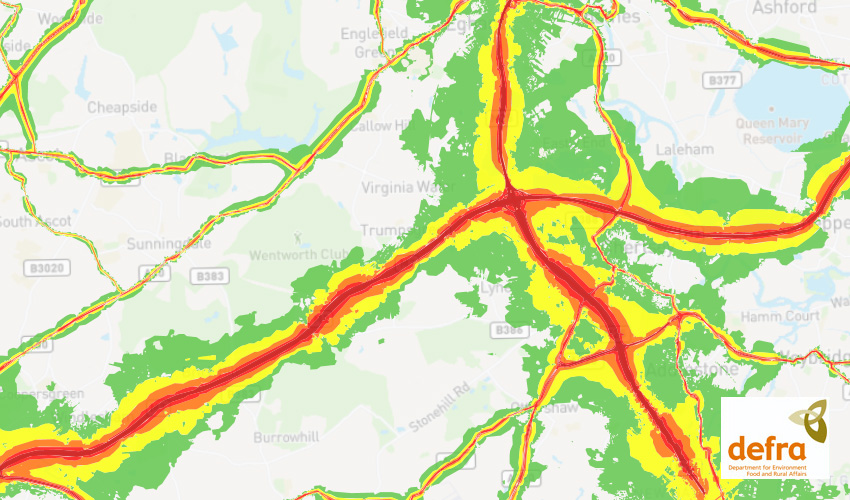
This is a set of 6 layers that show calculated average noise pollution from different transport types. It's graded from red (noisy) to green (not so noisy).
The 6 layers are:
- Rail Noise - 16 hour average (7am to 11pm)
- Rail Noise - 24 hour average
- Rail Noise - Overnight (11pm to 7am)
- Road Noise - 16 hour average (7am to 11pm)
- Road Noise - 24 hour average
- Road Noise - Overnight (11pm to 7am)
Where does it come from?
DEFRA (Department for Environment, Food and Rural Affairs)
How often is it updated?
It's a one-off. The analysis was done in 2017. It's called their 'Round 3' so there may be future revisions.
What area does it cover?
England, in areas with a population of at least 100,000 people.
The rail dataset is limited to the Network Rail and HS1 network.
The road dataset is for all major road routes.
How might you use it?
This data can be useful if you're looking at sites of new developments, maybe even outdoor spaces and the relationship between those places and the average noise pollution. Noise pollution can have negative health implications is is worth considering.
Data Licence
OGL Open Government Licence v3.
Technical Blurb
Noise levels are modelled on a 10m grid at a receptor height of 4m above ground, polygons are then produced by merging neighbouring cells within the following noise classes:
The 16hr and 24hr datasets use this scale (in decibels dB):

The overnight datasets use this scale (in decibels dB):

(You can see we've kept the colours the same for a decibel band)
Back to Category
MORE INFORMATION